
- Abbasi, D. S. U. R. S., Aziz, L., & Khan, A. M. (2020). A Comparative Study Evaluating Performance of Old Traffic Police (OTP) & New Traffic Police (NTP) in Twin Cities (Rawalpindi & Islamabad). South Asian Studies, 29(1).
- Ahmed, M. (2008). Impact of mass awareness campaign of Motorway Police regarding public safety, (MPhil dissertation, AIOU, Islamabad.
- Ambak, K., Daniel, B. D., & Diman, K. (2007). A study on compliance of safety belt among car drivers in district of Batu Pahat, Johor.
- Bano, N (2012), Role Of Islamabad Traffic Police (ITP) 92.4 FM Radio In Creating awareness about Traffic Rules (MS dissertation, International Islamic University, Islamabad).
- Batool, Z. (2012). Attitudes towards road safety and aberrant behaviour of drivers in Pakistan (Doctoral dissertation, University of Leeds).
- Chaudhary, M. U. (2019). Revival of radio in Pakistan: Cultural, Political and Social Impact of Fm Radio on the youth (Doctoral dissertation, Islamia University, Bahawalpur.).
- Houldin, C., Stuart, T., & Murphy, P. (2012). Road User Awareness and Understanding of the Meaning of Traffic Signs. In European Transport Conference 2012Association for European Transport (AET) Transportation Research Board.
- Hovland, C. I. (1957). The order of presentation in persuasion.
- Islamabad traffic police official website August 1, 2020.
- Katz, E., Blumler, J. G., & Gurevitch, M. (1973). Uses and gratifications research. The public opinion quarterly, 37(4), 509- 523.
- Lasswell, H. D. (1948). The structure and function of communication in society. The communication of ideas, 37(1), 136- 139.
- Lewis, P. M. (1989). The invisible medium: Public, commercial and community radio. Macmillan International Higher Education.
- McQuail, D., Blumler, J. G., & Brown, J. (1972). (1972) The Television Audience: A Revised Perspective. In D. McQuail, Sociology of Mass Communications. Middlesex, England: Penguin, 135-165.
- Report, International organization for migration (31.08.2010). Haiti-IOM Launches Major Hurricane Season Awareness Campaign By Radio And SMS
- Severin, W. J., & Tankard, J. W. (1997). Communication Theories: Origins. Methods, and Uses in the Mass Media, 4th ed., White Plains, NY: Longman.
- Shabir, G., Hayat, M. N., & Hamad, N. (2014). Why People Violate Traffic Rules in Pakistan. Journal of Information Engineering and Applications, 4(12), 40-45.
- Shaikh, S., Baig, L. A., & Polkowski, M. (2017). Effectiveness of media awareness campaigns on the proportion of vehicles that give space to ambulances on roads: An observational study. Pakistan Journal of Medical Sciences, 33(1), 221.
- Tahir, S. N. (2016). Community radio a tool of social change: Still a far cry in Pakistan. University of Punjab, 19.
- Takada, M., Fukuda, Y., & Iwamiya, S. I. (2013). Questionnaire survey on vehicle horn use and its effects on drivers and pedestrians. Acoustical Science and Technology, 34(3), 187-196.
Abstract:
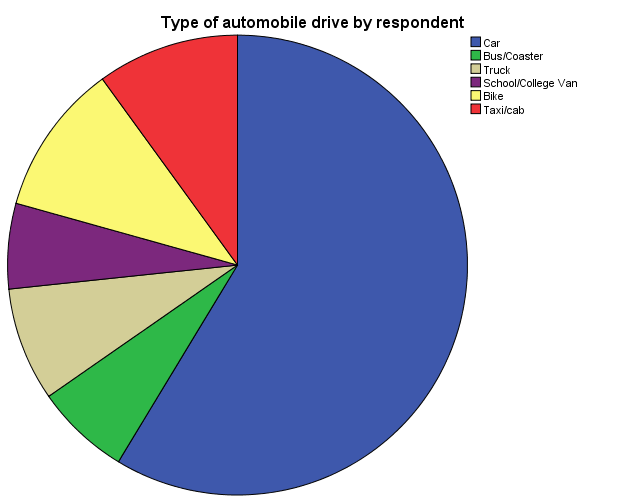
Islamabad Traffic Police FM 92.4 radio station is specifically designed to create road safety awareness along with entertainment for drivers of Islamabad, the capital of Pakistan. This study is survey-based research and a short study of ITP radio traffic awareness content and popular shows. The sample size was 300 drivers of Islamabad. With the help of the purposive sampling technique, the data was collected through a structured questionnaire. The number of male drivers were more than the number of female drivers. Results show that 95.7% of respondents knew about ITP FM radio while 71.0 % agreed that ITP FM radio is their only source of information regarding traffic rules and regulations. 64.0 % of drivers tune ITP FM radio while driving to get traffic information. Car drivers were 58.7 %, and the majority of the respondents were people who had above 9 years and up to 4 hours daily driving experience.
Key Words:
Traffic Awareness, Drivers, Road Safety ITP FM Radio, Islamabad
Introduction
Radio is an old and most powerful medium of communication. This sound medium can target a large audience because of its vast reach. Radio is the best means of electronic mass media for increasing awareness about road safety measures among drivers all over the world (Lewis, 1989). This study focuses on the effectiveness and adoption, by the listeners, of all types of messages Produced by ITP FM radio 92.4. This includes public service messages (PSM), road safety Promos, ITP news (Live traffic updates), road safety seminars/walks, ITP family Gala and all the shows of ITP FM radio 92.4 containing road safety measures or traffic awareness messages for road users.
In present times, radio with new technology has changed the lifestyle of the masses globally (Tahir, 2016). A modern broadcasting style, i.e. FM broadcasting system is very popular among audiences (Chaudhary, 2019). FM radio station 92.4 of Islamabad traffic police (ITP) is located in the F-8 sector of Islamabad. It has a transmitter of 1 kilowatt. ITP FM 92.4 can be heard in Islamabad, Rawalpindi, Rawat, Gujar khan, Texila, Hasanabdal and surrounding areas. It became the 6th non-commercial FM radio channel on 9th July 2009. ITP FM radio 92.4 transmits informative road safety awareness content for the drivers. Information is about traffic rules in normal routine, in any emergency, political protest, bad weather, or even about roads under construction in the city or during rush hour. The FM 92.4 radio service is not only creating awareness among the young generation but is also helping to eliminate traffic crimes in the city. It provides maximum traffic guidelines through its different programs (ITP FM | Islamabad Traffic Police, 2020).
The ITP FM 92.4 radio shows are very popular. The main contents of these shows consist of road safety. The entertainment (music) percentage is 70 %, and spoken word (content) is 30 % of the whole programming. Old and new Urdu, Punjabi, Saraiki, Sindhi, Balochi, Pashto, Potohari and English music is played in most of the programmes. Road safety seminars and walks arranged by Islamabad Traffic Police are the other modes of creating traffic safety awareness in the federal capital. Speech or Debate competition, as well as Quiz and singing competition between students, are arranged at different levels with traffic awareness messages. ITP family gala is arranged at F-9 Park Islamabad on a regular basis. It is a joint collaboration of ITP and District police. Family galas include more than 100 stalls, e.g. traffic awareness stall shopping stalls, display stalls, food festival, puppet show, magic show etc. In Pakistan, the traffic situation is now getting better because of such efforts. Islamabad traffic police and government are making combined efforts for creating better traffic conditions in the federal capital (ITP FM | Islamabad Traffic Police, 2020).
Objectives of the Study
1. To determine what role ITP radio FM 92.4 plays in creating traffic awareness in society.
2. To determine the driver’s adoption of road safety measures through ITP FM radio.
Literature Review
Several studies have been conducted locally and globally regarding road safety measures and about creating traffic awareness among drivers. Bano (2012) conducted a study entitled “Role of Islamabad Traffic Police (ITP) 92.4 FM radio station in creating awareness about traffic rules”. The nature of the research was quantitative, and the researcher used a survey method by using convenient nonprobability sampling. The sample was 120 respondents. The research tool was a questionnaire to measure knowledge, attitude and behaviour. The study showed that there is no statistically important contribution by the FM unit, but more attitude change is observed among those who mostly listen to ITP FM 92.4 channel.
According to a report of “International organization for migration” published on 31 August 2010, titled “Haiti-IOM Launches Major Hurricane Season Awareness Campaign by Radio and SMS”. The aim was to guide the Haitians about how they can protect themselves during hurricane season. A daily radio show is also launched by IOM, focusing mainly on reducing the disaster risk during the hurricane period. On 12 January 2010, about 1.5 million Haitians became homeless due to the earthquake. A special programme will also be broadcast on the network between 5 to 6 pm. The purpose of the campaign was to keep the Haitian well informed during any uncertain situation in the country.
Ambak et al, (2007) conducted a study about “compliance of safety belt usage among car drivers in the district of BatuPahat, Johar’’. In this study use of seat belts was observed among car drivers in Malaysia because it holds the driver in any car crash situation, and this is the only way to reduce road accidents. The main objective of this study was to check the level of safety belt usage among drivers and passengers and to identify the group who violated seat belt law. The survey method was applied for three months. The research tool was a questionnaire with 218 respondents (who were interviewed) and data was analyzed by using chi-square method. The results of study showed that the use of seat belts was more among educated drivers and they also had a positive attitude towards not to violate seat belt laws.
Shabir, Hayat, & Hamad, (2014) investigated in their article the factors that would be helpful in the implementation of traffic rules and how we can stop the road traffic accidents in Pakistan. The data was collected from masses, professional drivers, police officers and officials from all provinces. Random sampling is applied on selected strata. The research tool was a questionnaire. The findings showed that the traffic rule violation can be controlled through education road safety programs and law enforcement.
Batool (2012) describes in her study entitled “Attitude towards road safety and aberrant behaviour of drivers in Pakistan” the cause of road traffic accidents in Pakistan. In fact, personal attitude is the true picture of driving behaviour. Three studies were conducted. The first study was quantitative in nature to explore the road safety issues in Pakistan; by using the results of the first study, a second study was conducted to develop an attitudinal questionnaire. In the third study, real-world driving behaviour was observed using the wiener Fahrprobe technique. It was concluded that in Pakistan, driver’s behaviour is influenced by socio-demographic characteristics and driving environment. The student and elite class female have a negative impact on driving behaviour.
Houldin et al. (2012) found that traffic signs are the essential need of drivers while travelling. It is an important source of communication on Highways, with lots of information, e.g. speed limits signs, parking and directions, restricted zone, pedestrian zone, Height and weight restriction signs etc. The first stage was quantitative involving in-depth interviews, while the second stage consists of a household survey of 800 members. Finally, 36 signs were selected. Computer presentation of these signs was used in this survey. Interviews were conducted with new, experienced, foreign and HGV drivers and motorcyclists. The finding showed that road signs improve road safety.
Abbasi et al. (2014) conducted a comparative study in twin cities (Rawalpindi & Islamabad) to evaluate the systems of new and old traffic police and to check whether the old traffic system is better or new. A random sampling method was applied on 266 different drivers by using a questionnaire. It was noted that new traffic police dealing is good than OTP. They have a good attitude towards the public. They approach very frequently to accident spots. It was recommended that establishing a mature and honest traffic police system is in the best interest of society.
Ahmed (2008) investigated the impact of the mass awareness campaign of motorway police regarding public safety. The basic aim was to control the death and disabilities rate caused by traffic accidents. Mass media and interpersonal communication and persuasion are the basic elements to create traffic awareness for public safety. The researcher explored the five basic problems in the study area namely, lack of traffic awareness and law enforcement, poor legislation and engineering and lack of coordination. In Pakistan, due to efforts of National Highways and motorways police the level of traffic awareness has increased.
Shaikh et al (2017) studied effectiveness of media awareness campaigns on the proportion of vehicle that give space to ambulances on road. Mass media campaigns are considered as very successful campaigns. An observation was carried out in three different timings in Karachi. The campaign slogan was “Give way to the ambulance, it may be carrying someone close to you” data obtained, and 245 observations were analyzed. One vehicle did not give way to ambulance, two reasons were found, minibus stoppage and VIP movement. It was concluded that we can make a successful campaign by using mass media.
Takada (2013) carried out a survey on vehicle horn use and its effects on drivers and pedestrians. In Japan according to road traffic law you can use vehicle horn in an emergency or in suggested locations. Here drivers use unnecessary horns, they honked cyclists and pedestrians. A survey study was conducted. There were 140 drivers among the respondents. It was observed that drivers honked to get others attraction. Pedestrians also gave negative remarks about frequently use of horns. 40% non-drivers showed anger about horn volume and sound. It was suggested that driver should use horn according to traffic rule.
Theoretical Framework
The study sought the help of two theories i.e. Uses and Gratification theory and Persuasion theory, being the most relevant to the study.
Uses and Gratification Theory
Uses and gratification theory was introduced by Blumler and Katz in 1974, containing the assumption that media users are considered as goal oriented. Audience is aware of their needs and gratification for the selection of media (Katz, Blumler, &Gurevitch, 1973). The present research study relates to the gratification of ITP FM 92.4 radio listeners who use or select (tune) FM 92.4 radio channels for acquiring traffic-based information along with entertainment purposes. The uses and gratification persuade drivers (audience) to listen to radio programs of their own choice (specifically traffic awareness-based programs).
Katz said the purpose of the research was to answer the question, “What do media do to people”. Katz suggested another question, “What do people do with the media”. In 1940, the researchers began to evaluate patterns of uses and gratification theory in radio listeners. According to Lasswell (1948), media serves the functions of entertainment, surveillance, correlation, the transmission of culture between individuals and society. Katz (1959) was the first who introduced uses and gratification in an article when he came to know that people use mass media for their benefit. This concept came in the late fifties and early sixties. Kats, with his two fellows, Jay Blumer and Michael Gurevitch, worked continuously to flourish this concept (Katz, Blumler, &Gurevitch, 1973).
Individual Needs and Media Uses
The literature of uses and gratification has provided a classification of audience needs and gratifications. McQuail, Blumler and Brown (1972) suggested the following categories.
Surveillance
(watchdog function, seeking of information about happening in this complex World) Searching about events
a. Search for information
b. To know current happening in the world
c. To have good information
d. The greater the information you have, the braver you are.
Diversion
e. Escape from daily routine and problems.
f. Emotional release.
Personal Identity or Individual Psychology
g. Self-understanding
h. Reality exploration
Personal Relationship
i. Utility of social information in conversation.
j. Substitute of the media for companionship.
Persuasion Theory
Persuasion deals with the messages that change the attitude or behaviour of the receivers or persuasion is the information that is provided to influence the receiver attitude or behaviour (Hovland, 1957). Persuasion is a process in which messages are used without duress, to influence people's attitude (Severin & Tankard, 1997). It is due to persuasion, when someone has listened to some information, news, program, or entertainment (music) through radio channels, we tune the relevant radio station and persuasive message from mass media will influence the attitude of the receiver (drivers).
Fear Appeal in Persuasion
Fear appeal is referred to as a technique in mass communication to develop some fear among the audience (drivers). It is a persuasive message used to arouse feelings of fear to create behaviour or attitude change through threat of harm (Hovland, 1957).
Research Questions
RQ 1: What is level of exposure of ITP FM 92.4 Radio station among the drivers in Islamabad? To what extent Whether and to what extent drivers of Islamabad get exposure to the ITP FM 92.4 radio channel?
RQ 2: Whether and to what extent ITP FM 92.4 is playing its role in creating awareness among drivers regarding traffic rules?
The hypothesis of the Study
H1: Higher the listening of ITP FM radio programs among drivers, the higher will be the level of their road safety awareness.
Methodology
The research method used in this study was quantitative, involving a survey from drivers of Islamabad city. The collected data has been processed and analyzed by the SPSS. The population of this research consisted of drivers of Islamabad city, including residents of suburbs with age groups starting from 21 to above 60 years and different demographic characteristics. The sample size consisted of 300 drivers. A purposive sampling technique was used in this study. It is considered an economical and fast sampling technique. A self-administered questionnaire was used as an instrument for data collection.
Characteristics of the Sample
The sampling frame included the listeners of the ITP FM 92.4 radio channel, who are the residents of Islamabad city as well as some adjacent areas like Gujar Khan, Rawat, Hassanabdal, Taxila, and Rawalpindi etc. The sample consisted of male and female married and unmarried drivers, mostly having their driving license. They are car, bike, van, bus, truck, coaster, Suzuki, and taxi/cab drivers belonging to different occupational groups.
Analysis of Demographic Characteristics of Drivers
The demographic characteristics of the respondents describe the definite picture of the drivers, as shown in Table 1
| Demographic variables width="105" valign="top">Frequency width="108" valign="top">Percentage | > Gender | > Male width="105" valign="top">257 width="108" valign="top">85.7 | > Female width="105" valign="top">43 width="108" valign="top">14.3 | > Age | > 21-30 width="105" valign="top">84 width="108" valign="top">28.0 | > 31-40 width="105" valign="top">109 width="108" valign="top">36.3 | > 41-50 width="105" valign="top">89 width="108" valign="top">29.7 | > 51-60 width="105" valign="top">10 width="108" valign="top">3.3 | > Above 60 years width="105" valign="top">08 width="108" valign="top">2.7 | > Occupation | > Government employs width="105" valign="top">38 width="108" valign="top">12.7 | > Private employs width="105" valign="top">46 width="108" valign="top">15.3 | > Businessman width="105" valign="top">27 width="108" valign="top">9.0 | > Engineers width="105" valign="top">23 width="108" valign="top">7.7 | > Doctors width="105" valign="top">9 width="108" valign="top">3.0 | > Bankers width="105" valign="top">11 width="108" valign="top">3.7 | > Educationist width="105" valign="top">27 width="108" valign="top">9.0 | > Media persons width="105" valign="top">28 width="108" valign="top">9.3 | > Taxi / Cab drivers width="105" valign="top">30 width="108" valign="top">10.0 | > Public service drivers width="105" valign="top">37 width="108" valign="top">12.3 | > Heavy vehicle drivers width="105" valign="top">24 width="108" valign="top">8.0 | ||||||
Driving Routine of the Respondents
Table No. 2 shows that 58.7% of the respondents drive cars; secondly, 10.7% of people drive bikes or motorcycles. The analysis of data explains 6.7% were bus/coaster drivers, 8.0% were truck drivers, 6.0% were school/college van drivers and 10.0% respondents were driving taxi/cabs. The drivers with driving experience within the range 1-3 years were 11.0%. The drivers above 3 and up to 6 years’ experience were 16.0%, and above 6 and up to 9 years’ experience drivers were 22.0%. The drivers who had above 9 years’ experience were 51.0%.
The respondents who drive their automobile daily up to 2 hours were 23.0%. The drivers who drive above 2 and up to 4 hours daily were 32.7%. Above 4 and up to 6 hours drivers were 12.0%. Respondents who drive daily more than 6 hours were 32.3%. The results further show that mostly drivers had their driving license. 92.0% drivers had their driving license while 8.0% respondent had no driving license
Exposure to ITP FM-Radio Popular Shows
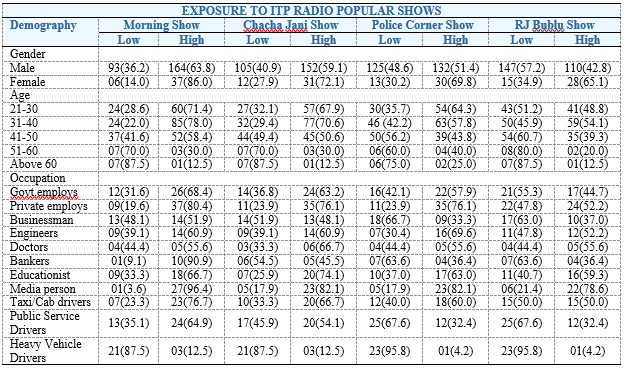
Table No. 3 depicts the exposure to ITP FM-radio popular shows in regards to the demography of the drivers. The data was gathered on a five-point Likert scale: Strongly disagree = 1, Disagree = 2, Neutral = 3, Agree = 4, Strongly agree = 5. After data entry in SPSS, the variables related to ITP FM radio popular shows were re-coded. The values of strongly agree and agree were re-coded as “High exposure”, and (1-3) values were re-coded as “Low exposure”. Results showed that male drivers are getting more exposure to ITP FM-radio popular shows than female drivers. Male (63.8%) and female (86.0%) high exposure was
observed in the morning show (Salaam Pakistan). Similarly, the low exposure values are male (36.2%) and female (14.0%) respectively.
As regards the age of the respondents, the drivers between 31-40 are more exposed to ITP FM radio morning shows (78.0%) than other shows. ChachaJani (70.6%), Police corner (57.8%) and RJ Bublu (54.1%). Master level students are having higher exposure to morning shows. Married respondents are having high exposure to ITP FM radio shows. 70.3% drivers of urban areas tune morning shows, ChachaJani 64.2%, Police corner 57.2%, and RJ Bublushow (48.0%). Likewise, private employees and respondents who have monthly income (21,000-40,000) have more exposure to ITP radio shows than other income categories.
Exposure to ITP FM-Radio Traffic Awareness Content
The traffic awareness content includes Public service messages (PSM), ITP news updates after every half an hour and live reports which include live situational reports. The variable values show that male respondents have more exposure to ITP radio traffic awareness content than female respondents. The respondent’s age group 31-40 have more exposure to traffic awareness content than other age groups.
Similarly, master’s degree holder drivers have higher exposure to traffic awareness content than other educational levels. The married respondents living in urban areas are more exposed to traffic awareness content than rural areas. It was observed that private employees have more exposure than other professionals, including Taxi/Cab drivers, Public service drivers and Heavy vehicle drivers.
| Exposure To ITP Radio Traffic Awareness Content | > Demography width="146" colspan="2">Public Service Messages width="134" colspan="2">ITP News Updates width="133" colspan="2">Live Reports | > Low width="78">High width="65">Low width="69">High width="62">Low width="71">High | > Gender width="413" colspan="6">
| > Male width="68">44(17.1) width="78">213(82.9) width="65">48(18.7) width="69">209(81.3) width="62">37(14.4) width="71">220(85.6) | > Female width="68">03(7.0) width="78">40(93.0) width="65">02(4.7) width="69">41(95.3) width="62">01(2.3) width="71">42(97.7) | > Age width="413" colspan="6">
| > 21-30 width="68">13(15.5) width="78">71(84.5) width="65">12(14.3) width="69">72(85.7) width="62">13(15.5) width="71">71(84.5) | > 31-40 width="68">12(11.0) width="78">97(89.0) width="65">12(11.0) width="69">97(89.0) width="62">07(6.4) width="71">102(93.6) | > 41-50 width="68">18(20.2) width="78">71(79.8) width="65">21(23.6) width="69">68(76.4) width="62">14(15.7) width="71">75(84.3) | > 51-60 width="68">04(40.0) width="78">06(60.0) width="65">05(50.0) width="69">05(50.0) width="62">04(40.4) width="71">06(60.0) | > Above 60 width="68">00(0.0) width="78">08(100.0) width="65">00(0.0) width="69">08(100.0) width="62">00(0.0) width="71">08(100.0) | > Occupation width="413" colspan="6">
| > Govt. employs width="68">05(13.2) width="78">33(86.8) width="65">07(18.4) width="69">31(81.6) width="62">01(2.6) width="71">37(97.4) | > Private employs width="68">02(4.3) width="78">44(95.7) width="65">02(4.3) width="69">44(95.7) width="62">05(10.9) width="71">41(89.1) | > Businessman width="68">04(14.8) width="78">23(85.2) width="65">03(11.1 width="69">24(88.9) width="62">01(3.7) width="71">26(96.3) | > Engineers width="68">03(13.0) width="78">20(87.0) width="65">02(8.7 width="69">21(91.3) width="62">03(13.0) width="71">20(87.0) | > Doctors width="68">01(11.1) width="78">08(88.9) width="65">00(0.0 width="69">09(100.0) width="62">00(0.0) width="71">09(100.0) | > Bankers width="68">01(9.1) width="78">10(90.9) width="65">01(9.1 width="69">10(90.9) width="62">01(9.1) width="71">10(90.0) | > Educationist width="68">01(3.7) width="78">26(96.3) width="65">02(7.4 width="69">25(92.6) width="62">00(0.0) width="71">27(100.0) | > Media person width="68">04(14.3) width="78">24(85.7) width="65">03(10.7) width="69">25(89.3) width="62">01(3.6) width="71">27(96.4) | > Taxi/cab drivers width="68">05(16.7) width="78">25(83.3) width="65">06(20.0) width="69">24(80.0) width="62">06(20.0) width="71">24(80.0) | > Public Service Drivers width="68">10(27.0) width="78">27(73.0) width="65">10(27.0) width="69">27(73.0) width="62">08(21.6) width="71">29(78.4) | > Heavy Vehicle Drivers width="68">11(45.8) width="78">13(54.2) width="65">14(58.3) width="69">10(41.7) width="62">12(50.0) width="71">12(50.0) | ||||||
Distribution of Drivers by their Level of Knowledge about Traffic Regulations
Table 5 shows a clear picture of the level of driver’s knowledge about traffic regulations. 70.3% of drivers agreed that vehicle screen should always be kept clean. 32.3% of respondents said that Hazard Lights are used in an emergency. 92.3% of drivers gave the correct answer that the speed limit near the school and mosque is 40 km. Only 36.7% of people recognized that shape of the warning sign is a triangle. 45.0% of respondents said both head and fog lights could be used in fog. The respondents who gave the correct answer, i.e. to reduce speed, is the rule about passing animals on the road were 85.0%.
Most drivers gave wrong answers about colour of reverse light, which was 69.3%, while 30.7% of respondents gave the correct answer that the colour of reverse light is white. 89.0% of respondents said that zebra crossing is for pedestrians. Only 28.3% of respondents agreed that the right time to switch your vehicle lights on is 20 minutes before sunset, while 71.7% of drivers gave wrong answers. Lastly, 55% of respondents gave correct answer that emergency vehicle can cross red light and 45% gave wrong answers.
| Drivers Level of Knowledge on Traffic Regulations | > Statements width="193" colspan="2">Correct Answers width="179" colspan="2">Wrong Answers | > What should always be kept clean on your vehicle width="126">Screen width="67">211(70.3) width="112">Lights>Windows>Reflectors width="67">89(29.7) | > Hazard lights are used in width="126">Emergency width="67">97(32.3) width="112">Fog>Racing>Parking Area width="67">203(67.6) | > The speed limit near school and mosque is width="126">40 km width="67">277(92.3) width="112">70 km>50 km>60 km width="67">23(7.7) | > The shape of the warning sign is width="126">Triangle width="67">110(36.7) width="112">Circle>Rectangle>None of these width="67">190(63.3) | > Which set of lights can be>used in fog width="126">Both head & fog lights width="67">135(45.0) width="112">Headlights>Fog lights>None of these width="67">165(54.9) | > What is the rule about passing animal on the road width="126">Reduce speed width="67">255(85.0) width="112">Use horn>Increase speed>Start shouting width="67">45(15) | > Colour of the reverse light is width="126">White width="67">92(30.7) width="112">Red>Green>No light width="67">208(69.3) | > Zebra crossing is for width="126">Pedestrians width="67">267(89.0) width="112">Cycle>Animals>None of these width="67">33(11) | > When should you switch>your vehicle lights on width="126">20 minutes before sunset width="67">85(28.3) width="112">10 min after sunset>At sunset>In full darkness width="67">215(71.7) | > Can emergency vehicle cross red light width="126">Yes width="67">165(55.0) width="112">No>In emergency>Don’t know width="67">135(45) | ||||
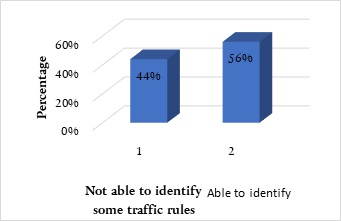
According to the research findings of the positive or negative attitude of drivers regarding traffic laws. Figure 2 shows that out of a total of 300 samples, 44 percent of drivers were not able to identify some traffic rules, while 56 percent of drivers were able to identify some traffic rules. This indicates that most drivers were aware of traffic rules.
Answering Research Questions
RQ 1: Whether to what extent drivers of Islamabad get exposure to ITP FM 92.4 radio channel?
ANS: As regards the exposure of drivers, 95.7% of respondents replied that ITP FM stands for Islamabad traffic police while 4.3% of drivers gave wrong answers. 71.0% prefer ITP FM as the respondents’ source about traffic rules. 5.0% replied newspaper, 3.7% respondents said TV channels and 20.3% drivers showed dependency on other sources for getting any information regarding traffic rules. As far as listening is concerned, 64.0% of drivers listen to ITP FM radio while driving, 25.3% through mobile, 7.0% at home/office and 3.7% on any other places.
| Statements width="120">Frequency width="108">Percent | > Islamabad Traffic Police FM width="120">287 width="108">95.7 | > Interactive Training Program FM width="120">7 width="108">2.3 | > Information Technology Project FM width="120">6 width="108">2.0 | > Total width="120">300 width="108">100.0 |
| Statements width="168" valign="bottom">Frequency width="150" valign="bottom">Percent | > ITP FM 92.4 width="168">213 width="150">71.0 | > Newspaper width="168">15 width="150">5.0 | > TV channels width="168">11 width="150">3.7 | > Any other source width="168">61 width="150">20.3 | > Total width="168">300 width="150">100.0 |
| Statements width="168" valign="bottom">Frequency width="149" valign="bottom">Percent | > While driving width="168">192 width="149">64.0 | > Through mobile width="168">76 width="149">25.3 | > At home/Office width="168">21 width="149">7.0 | > Any other place width="168">11 width="149">3.7 | > Total width="168">300 width="149">100.0 |
RQ 2: Whether to what extent ITP FM 92.4 is playing its role in creating awareness among drivers regarding traffic rules?
ANS: The data analysis shows that the ITP FM 92.4 radio channel is creating traffic awareness through its PSM, ITP news (updates after every 30 min), live situational reports, radio shows, ITP family gala, walks and seminars. The audience participation through live call/SMS/Facebook messages etc is the sources to enhance awareness regarding traffic rules among people. The higher awareness values are PSM (82.9%), ITP news (81.3%) and live reports (85.6%).
Age groups 31-40 have more awareness of traffic rules than other age groups. Master degree holders have more traffic awareness. The married drivers are more aware than unmarried. Similarly, the drivers of urban areas were more aware of traffic rules than rural areas. The age group (31-40) of drivers shows that they know more about ITP edutainment.
About 51.3% of the respondents strongly agreed, and 31.3% agreed that ITP FM radio is the only source of creating awareness among drivers. 12.0 % of respondents neutral, 3.7% disagreed, and 1.7% strongly disagreed about the statement, i.e. source of traffic awareness.
Correlation Analysis
Table 8 is a cross tab of the ITP radio morning show “Salam Pakistan” with automobile check. The correlation values between the two variables are shown in the table. The significance value of Pearson’s correlation is .051c that shows there is a weak correlation between the two variables. Therefore, more efforts are required to educate people through the ITP radio morning show.
| width="305" colspan="5"> I always check my automobile before driving width="42" rowspan="2">Total | > Strongly Disagree width="78">Disagree width="76">Neutral width="38">Agree width="54">Strongly Agree | > Influence of morning show segments on learning traffic rules width="104" colspan="2">Strongly disagree width="59">0 width="78">0 width="76">0 width="38">2 width="54">0 width="42">2 | > Disagree width="59">1 width="78">3 width="76">0 width="38">2 width="54">3 width="42">9 | > Neutral width="59">2 width="78">15 width="76">6 width="38">29 width="54">36 width="42">88 | > Agree width="59">3 width="78">16 width="76">9 width="38">41 width="54">36 width="42">105 | > Strongly agree width="59">4 width="78">8 width="76">2 width="38">35 width="54">47 width="42">96 | > Total width="59">10 width="78">42 width="76">17 width="38">109 width="54">122 width="42">300 | > Symmetric Measures | > Correlation width="60" colspan="2">Value width="78">Asymptotic Standardized Errora width="76">Approximate Tb width="134" colspan="3">Approximate Significance | > Interval by Interval width="127" colspan="2">Pearson's R width="60" colspan="2">.113 width="78">.058 width="76">1.955 width="134" colspan="3">.051c | > Ordinal by Ordinal width="127" colspan="2">Spearman Correlation width="60" colspan="2">.111 width="78">.058 width="76">1.925 width="134" colspan="3">.055c | > N of Valid Cases width="60" colspan="2">300 width="78">width="76"> width="134" colspan="3">
| height="0"> width="23"> width="104"> width="0"> width="59"> width="78"> width="76"> width="38"> width="54"> width="42"> | ||||||||||||||||||||||||
So, Hypothesis 1, “Higher the listening of ITP FM radio programs among drivers, higher will be the level of their road safety awareness”, is not supported.
Findings
A total of 95.7% of respondents know about ITP FM radio, while 71.0 % agreed that only ITP FM radio is their source of information regarding traffic rules, and they mostly listen to it while driving. Percentage of married drivers, 31-40 age, doing mostly private jobs, having monthly income ranging 21,000 to 40,000 with Master level education, living in urban areas, having driving licenses were observed more than others.
Similarly, 64.0% of drivers tune ITP FM radio while driving to get traffic information. About 58.7% were car drivers, the drivers who had above 9 years and up to 4 hours daily driving experience were considered more. Male drivers were more exposed to popular ITP FM radio shows. 31-40 age groups were more exposed to the morning show “salam Pakistan” than other shows. Male married master degree plus license holder private employees 31-40 age group living in urban areas are more exposed to ITP radio edutainment. As regards exposure to ITP FM radio traffic awareness content, married private employees with master degree holders between 31-41 age group living in urban areas are more exposed to ITP radio Public service messages, ITP news and live reports.
ITP FM radio is creating attitudinal change among drivers by its persuasive traffic awareness content (knowledge), which is affecting their behaviour to adopt road safety measures (Hovland, 1957). It was observed that there is a gradual contribution of ITP FM radio in creating road traffic awareness. It was concluded that traffic awareness content produced and broadcast by ITP FM radio has an influence on driver’s behaviour, but more awareness is required. Although drivers do not listen to ITP popular shows much, mostly they follow traffic rules. The study supports the Uses and Gratification theory as the ITP FM has been found gratifying to the needs of the users, and furthermore, it is persuading the listeners to follow traffic regulation (Katz, Blumler, & Gurevitch, 1973).
References
Cite this article
-
APA : Hussain, S., Iqbal, W., & Shahzad, F. (2021). Impact of Islamabad Traffic Police FM Radio in Adoption of Road Safety Measures among Drivers. Global Mass Communication Review, VI(I), 79-95. https://doi.org/10.31703/gmcr.2021(VI-I).07
-
CHICAGO : Hussain, Shahid, Wasim Iqbal, and Farrukh Shahzad. 2021. "Impact of Islamabad Traffic Police FM Radio in Adoption of Road Safety Measures among Drivers." Global Mass Communication Review, VI (I): 79-95 doi: 10.31703/gmcr.2021(VI-I).07
-
HARVARD : HUSSAIN, S., IQBAL, W. & SHAHZAD, F. 2021. Impact of Islamabad Traffic Police FM Radio in Adoption of Road Safety Measures among Drivers. Global Mass Communication Review, VI, 79-95.
-
MHRA : Hussain, Shahid, Wasim Iqbal, and Farrukh Shahzad. 2021. "Impact of Islamabad Traffic Police FM Radio in Adoption of Road Safety Measures among Drivers." Global Mass Communication Review, VI: 79-95
-
MLA : Hussain, Shahid, Wasim Iqbal, and Farrukh Shahzad. "Impact of Islamabad Traffic Police FM Radio in Adoption of Road Safety Measures among Drivers." Global Mass Communication Review, VI.I (2021): 79-95 Print.
-
OXFORD : Hussain, Shahid, Iqbal, Wasim, and Shahzad, Farrukh (2021), "Impact of Islamabad Traffic Police FM Radio in Adoption of Road Safety Measures among Drivers", Global Mass Communication Review, VI (I), 79-95
-
TURABIAN : Hussain, Shahid, Wasim Iqbal, and Farrukh Shahzad. "Impact of Islamabad Traffic Police FM Radio in Adoption of Road Safety Measures among Drivers." Global Mass Communication Review VI, no. I (2021): 79-95. https://doi.org/10.31703/gmcr.2021(VI-I).07